What is Risk Impact Sensitivity Analysis and how does it relate to on time completion of projects? More importantly, why is this knowledge important to you, as a project professional?
In this blog post I will introduce a methodology that I call “Risk Impact Sensitivity Analysis” or RISA for building project schedules. Risk Impact Sensitivity Analysis is an effective method to evaluate the sensitivity of your project schedule to risks. It will account for risks resulting in more realistic schedule estimates thereby increasing your chances of completing the project on time.
Using a typical construction project as an example, I demonstrate in this blog post how you can apply Risk Impact Sensitivity Analysis.
1. Introduction to Risk Impact Sensitivity Analysis (RISA)
How often do you finish your projects on time?
The likely answer is: Not often! Survey after survey reveals that projects are replete with schedule delays.
The usual suspect? Risks.
Ignoring risks will result in overly optimistic project schedules, which are almost impossible to meet.
There are two types of risks that have a significant negative impact on project schedules: variability risk and events risk (Table 1).
Most project teams develop project schedule estimates using deterministic methods. These methods employ a single—a most likely (same as most probable)—value for estimating the duration of any given task of a project. Using single values for all the tasks that comprise the project scope of work, the overall project duration is calculated by applying the critical path method (CPM). Deterministic methods do not account for the variability risk associated with the estimates.
Furthermore, events’ risk (caused by specific risk events) is often ignored in estimating the schedules. If at all such risk is considered, qualitative methods are employed to analyze and prioritize the risk events prior to developing response actions.
Qualitative methods involve estimates of most likely probabilities of occurrence for each risk identified and most likely impact of those risks on project schedule using a nominal scale where measurements are based on discrete categories rather than numeric values.
Typical categories include low, medium, and high. If quantitative analysis is applied, deterministic methods are common in estimating risk impacts—again, ignoring the variability risk associated with these estimates.
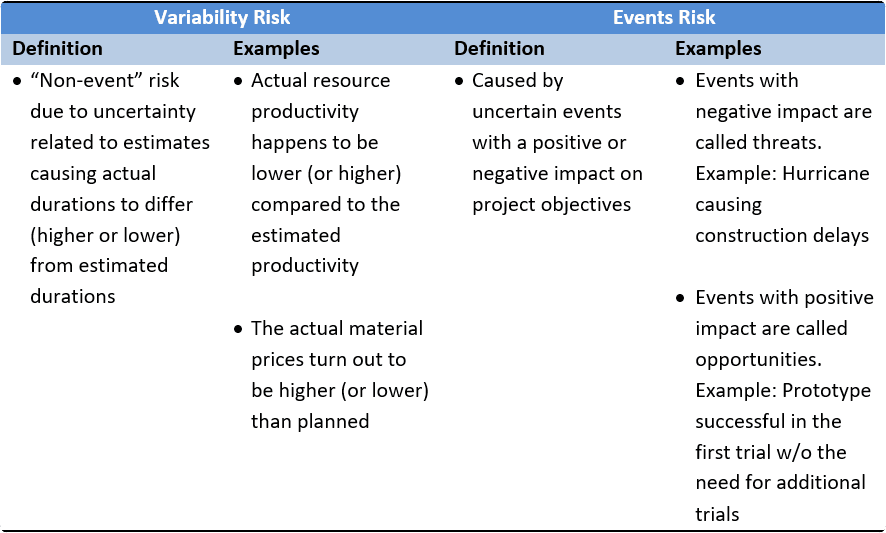
Table 1: Defining Variability and Events Risk for Risk Impact Sensitivity Analysis
As defined in Table 1 above, risks may have either negative or positive impact on project objectives and are called threats and opportunities, respectively.
However, in many organizations threats are referred to as risks. In this blog post, to keep my illustrations simple and easy to understand, I use only threats and refer to them as risks as well. But the principles and the application of the tools for analyzing threats and opportunities are basically the same.
2. Quantitative Risk Analysis (QRA) and Risk Impact Sensitivity Analysis
Whereas deterministic estimation and qualitative methods for risk analysis are a first step in project scheduling, sophisticated quantitative analysis with stochastic tools offer you more meaningful insights and results.
Stochastic – also referred to as probabilistic – methods involve estimates based on ranges with probabilities rather than single, deterministic values.
Quantitative Risk Analysis (QRA) is an effective approach to identify, analyze, and prioritize risks. You’ll have a better understanding of the risk impacts, so you can develop proper response actions.
How do you develop risk response action plans?
Typical strategies for response actions are avoidance, mitigation, transfer, acceptance, and escalation (Table 2 below).

Table 2: Risk Response Strategies
Risks can never be eliminated altogether. In fact, you may not want to eliminate all risks, because certain risks are unlikely to materialize and so why spend resources on them?
Therefore, a prudent approach is to take proactive measures for significant risks and establish contingency reserves for the overall remaining “residual” risk. Typically, the reserves are calculated as a percentage of estimated total project cost, but QRA offers a more rational approach.
Risk Impact Sensitivity Analysis (RISA) is a form of QRA. It involves Monte Carlo simulations incorporating variability and events risks into project scheduling process. You can analyze the simulation results utilizing various RISA tools (Table 3).
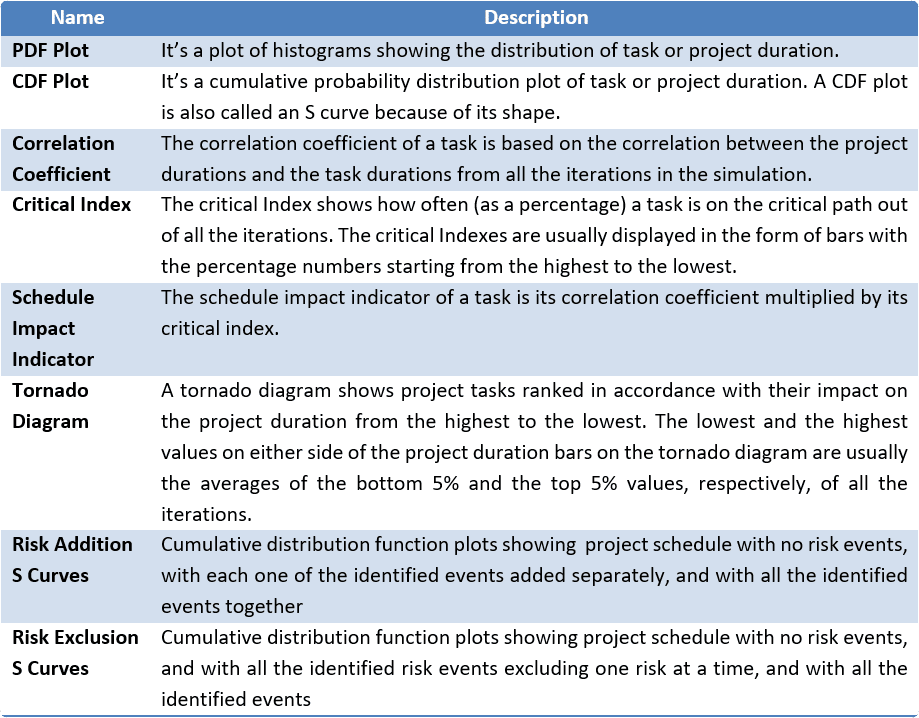
Table 3: Risk Impact Sensitivity Analysis (RISA) Tools for Schedule Risk Analysis
Risk Impact Sensitivity Analysis will help you develop more realistic project duration estimates leading to a higher chance of project schedule success. The key characteristics of the Risk Impact Sensitivity Analysis are:
1) Considers both variability and events risks.
2) Employs stochastic methods involving Monte Carlo simulations.
3) Performs sensitivity analysis to evaluate and prioritize risks.
4) Develops reserves based on rational methods.
I use a hypothetical construction project, called Project Pinot, as an example to illustrate the application of the Risk Impact Sensitivity Analysis (RISA).
3. Project Pinot to demonstrate the use of Risk Impact Sensitivity Analysis
Acme Chemicals Corporation (Acme) is a small specialty chemicals manufacturing company with its major operating facility located in Baton Rouge, Louisiana, USA.
The board of directors is considering a major expansion at this facility to manufacture a new class of chemicals. A significant part of this initiative is managing the large volume of process wastewater resulting from the proposed expansion.
The wastewater currently generated at this facility is discharged into the local municipal sewer. Acme pays a “surcharge” to the city based on the daily volume and pollutant load.
The proposed expansion will increase the wastewater volume as well as pollutant load. An internal team has conducted a preliminary investigation and recommended an onsite wastewater treatment plant (WWTP) instead of using the local sewer. They estimated that the investment will exhibit a rapid payback as well as significant cost savings compared to the municipal surcharges.
The board has authorized a feasibility study that involves bench-scale “treatability” testing of the “simulated” wastewater expected to be generated after the expansion is completed. The study’s objective is to investigate whether a new innovative technology recommended by Acme’s R&D will be effective to remove the pollutants to the levels mandated by the Louisiana Department of Environmental Quality (LDEQ).
Furthermore, the study will help develop the design basis for the full-scale WWTP. The board has also approved funds for developing a conceptual design of the system based on the feasibility study results and defining the scope of work to build the WWTP along with project schedule and cost estimates.
Upon completion of this task, there’ll be a go/no-go decision check point. A project team has been assembled. Project Pinot is born!
3.1 Project Assumptions & Constraints
The project team has met a few times and developed the preliminary scope of work. Their task now is to put together a preliminary schedule. To help the team with this effort, the project manager has provided them with the following information.
- The expected start date of the project is January 2nd of the coming year.
- The feasibility study will be conducted by an external vendor.
- An effluent discharge permit must be obtained from LDEQ before Acme can start discharging the final effluent to the nearby Mississippi.
- Acme has the option to continue discharging its untreated wastewater to the local sewer. But the surcharge cost may make the expansion cost prohibitive.
- The environmental permit application as well as all the construction permit applications will be prepared by the company’s regulatory specialist.
- Acme’s engineering department will be responsible for the front-end engineering and design (FEED), while the detailed engineering will be outsourced.
- A pair of customized pumps is required for the project that could take a long time to procure.
- Construction work including equipment installation will also be outsourced. It’s likely that this effort will take place during the hurricane season.
3.2 Risk Impact Sensitivity Analysis: Methodology Steps & Project Pinot Results
Using the Project Pinot scenario, I illustrate below the key steps involved in developing the project schedule using Risk Impact Sensitivity Analysis (RISA). As I go through the step-by-step process, I refer to the figures and tables where the RISA data for Project Pinot is presented.
3.2.1 Risk Impact Sensitivity Analysis (RISA) Step 1: Develop The Base Schedule Estimate
First, you develop the base schedule estimate using single values of the most likely durations of each task comprising the project scope of work and CPM model. It’s referred to as the deterministic schedule since the duration estimates are deterministic (Fig. 1 and Fig. 2 below).
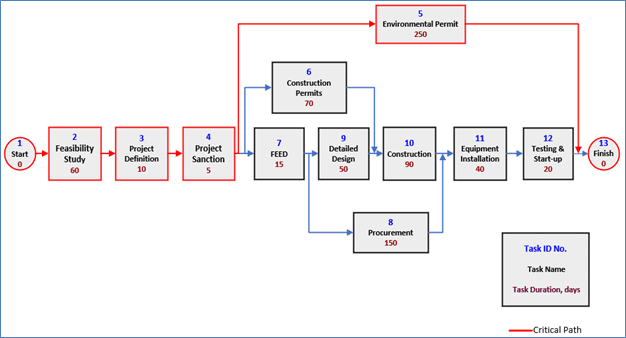
Figure 1: Network Diagram used in Risk Impact Sensitivity Analysis Scenario
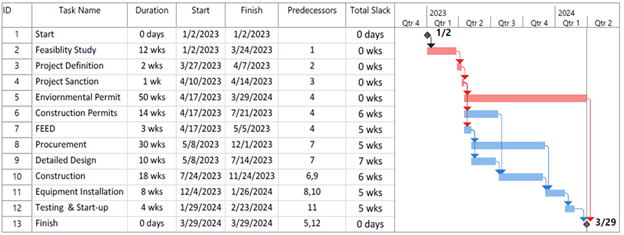
Figure 2: Gantt Chart used in Risk Impact Sensitivity Analysis Case Study
3.2.2 Risk Impact Sensitivity Analysis (RISA) Step 2: Define Distributions And Their Parameters For Task Durations
For every single task in the schedule estimate, select the distribution type you believe is most appropriate. The distribution is meant to represent variability risk associated with your estimates.
The two most common distributions in project scheduling are pert and triangular. The latter is more conservative resulting in longer task and project durations. The parameters for both distributions are minimum, most likely, and maximum values.
Typically, the distribution type and parameters are selected based on subject matter expertise, team input, and historical data. For the sake of simplicity and illustration purpose:
➡️ I applied pert, triangular, or no distribution depending upon the presumed uncertainty associated with the tasks.
➡️ The minimum and maximum values for tasks where pert or triangular distribution is applied are -10% and +25% of the most likely values, respectively (Table 4 below). I use the same approach for the impact of risk events discussed in the next step.
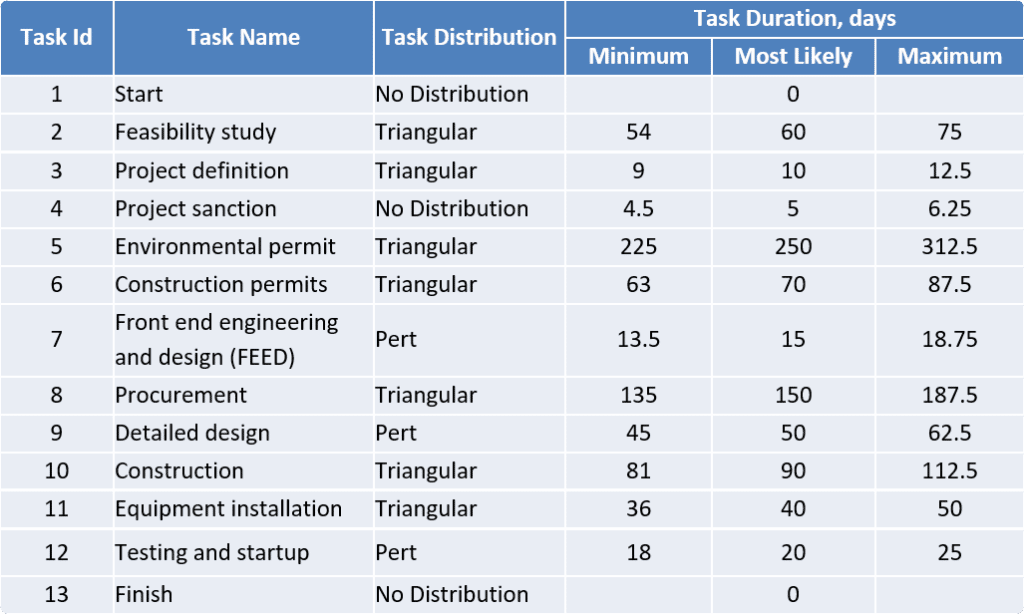
Table 4: Variability Risk for Each Task in Risk Impact Sensitivity Analysis Scenario
3.2.3 Risk Impact Sensitivity Analysis (RISA) Step 3: Prepare A Risk Register
Identify threat events for the project. (As mentioned before, for the sake of illustration, I use only threats, not opportunities, in this example.) Estimate each event’s probability of occurrence and the impact if it occurs. Identify the tasks that will be impacted and estimate the extra time duration expected to be caused by each risk event.
In addition, identify if new tasks will be created because of the impact and if so, estimate their duration. Make sure you also identify any risk events that are mutually exclusive and if so, quantify their exclusivity.
Define any changes in task dependencies. Select the distribution (e.g., pert, triangle, etc.) for the impact durations and estimate their distribution parameters (e.g., minimum, most likely, and maximum values).
Select the proper frequency distribution of each risk event and estimate its distribution parameters. You may select Bernoulli, if the event is expected to happen only once during the project implementation phase or Poisson, if it can happen more than once. The distribution parameter for Poisson is called lambda, which represents the average rate of occurrence of an event in a fixed interval of time.
Document the risks identified and their probabilities, impacts, distribution information, etc. in the risk register (Table 5 below). It’s imperative that this overall effort of preparing the risk register involves input from subject matter experts and the project team.
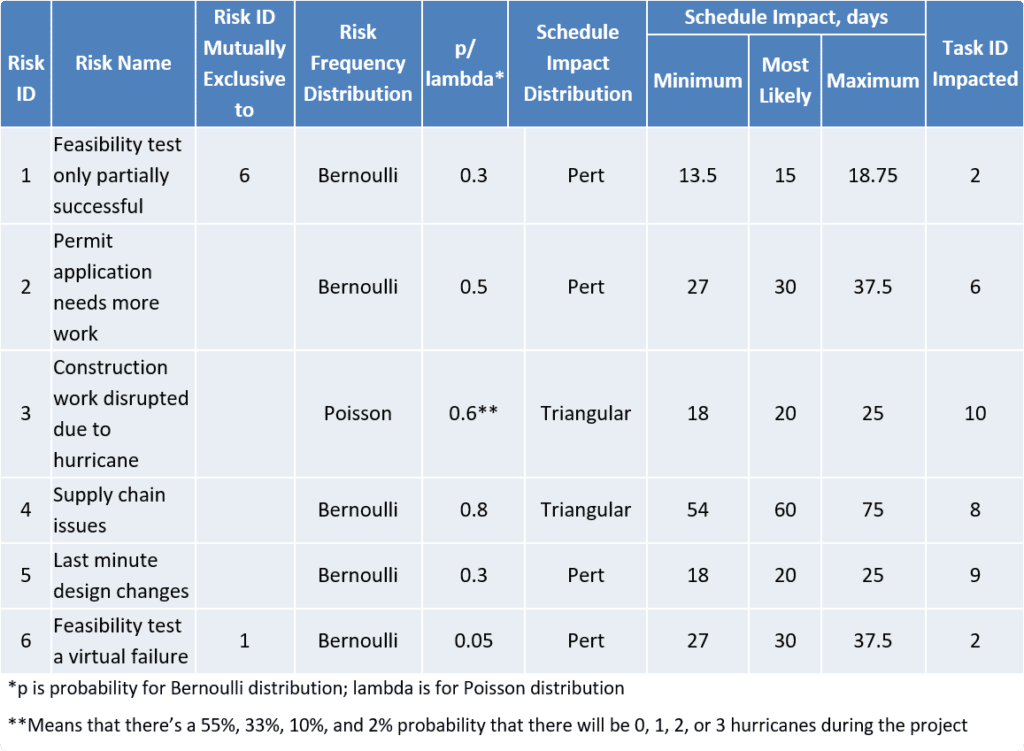
Table 5: Risk Register used in Risk Impact Sensitivity Analysis Scenario
3.2.4 Risk Impact Sensitivity Analysis (RISA) Step 4: Perform Monte Carlo Simulations
Incorporating the variability and events risks information into the base schedule estimate, perform Monte Carlo simulations for developing the stochastic estimates of the project duration. For a simple description of the Monte Carlo simulation process for project scheduling, please refer to Table 6 below.
The input data for the simulation of Project Pinot’s schedule is already given in Tables 4 and 5.
I performed the Monte Carlo simulation using a software application called HawkEye that my team and I developed. The software not only runs the simulations but also presents the results in different formats using various RISA tools. All the figures presented in this paper are for Project Pinot and were generated using HawkEye.
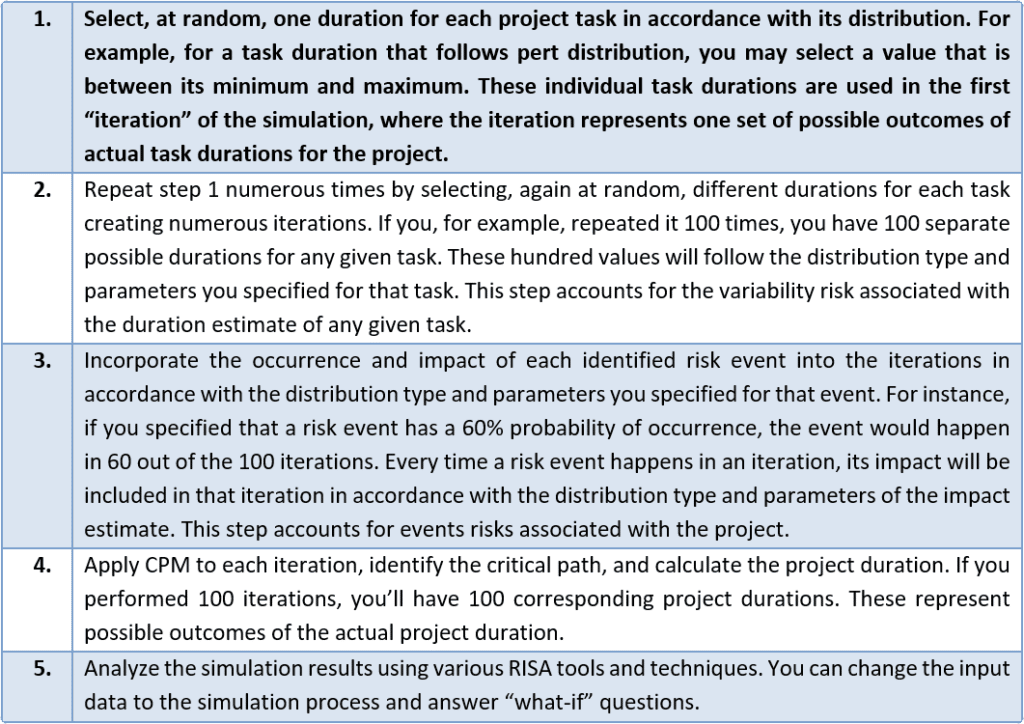
Table 6: Basic Steps of Monte Carlo Simulation for Project Schedule
Fig. 3 and Fig. 4 below present the probability distribution function (PDF) and cumulative distribution function (CDF) plots of the project schedule, respectively. Each figure includes plots accounting for only the variability risk and both variability and events risks together. (The CDF plots are generally referred to as S curves due to their shape.)
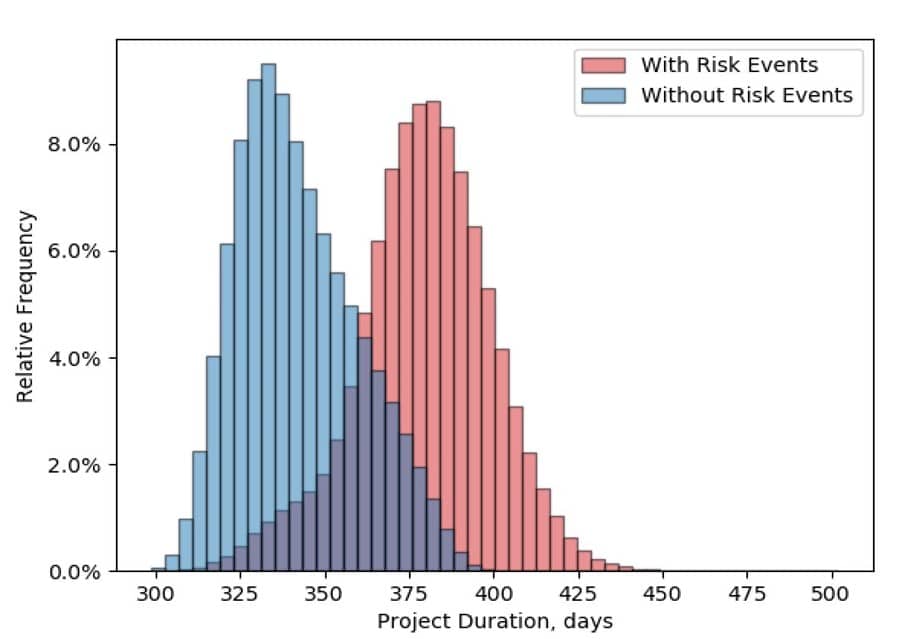
Figure 3: PDF Plots With and Without Risk Events in Risk Impact Sensitivity Analysis Scenario
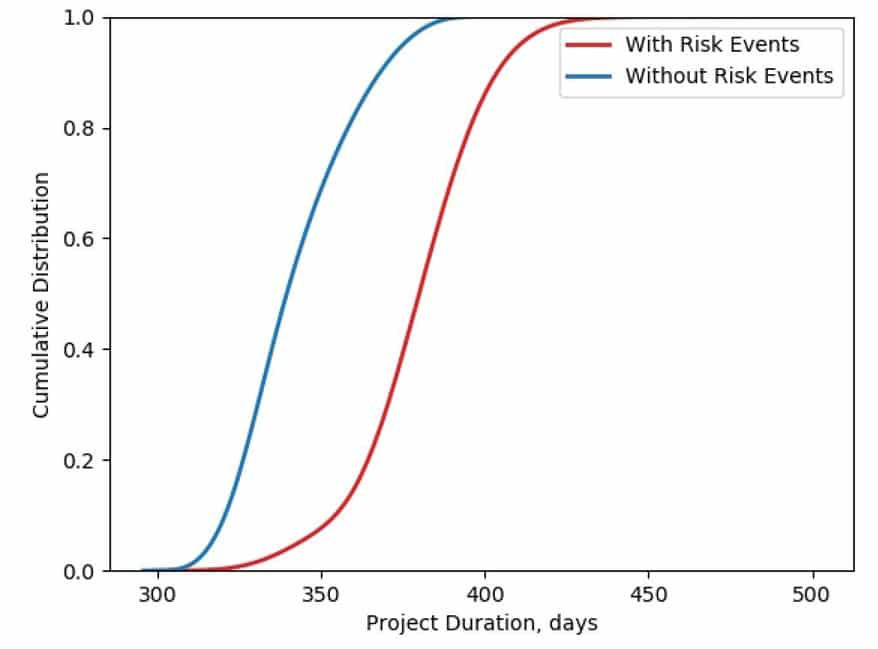
Figure 4: CDF Plots With and Without Risk Events in Risk Impact Sensitivity Analysis Scenario
3.2.5 Risk Impact Sensitivity Analysis (RISA) Step 5: Conduct Risk Impact Sensitivity Analysis and Prioritize Risks.
You can apply several Risk Impact Sensitivity Analysis (RISA) tools (listed in Table 3) to analyze the simulation results and prioritize the risks. If you want to accelerate the schedule, these results can also give you insights into where you may want to fast-track and by how much.
Fig. 5 below is a tornado diagram showing how the project duration varies as the duration of a task varies. Whereas Fig. 6 is a “half tornado” diagram where the correlation coefficients are displayed. Fig. 7 is a similar diagram showing critical indexes.
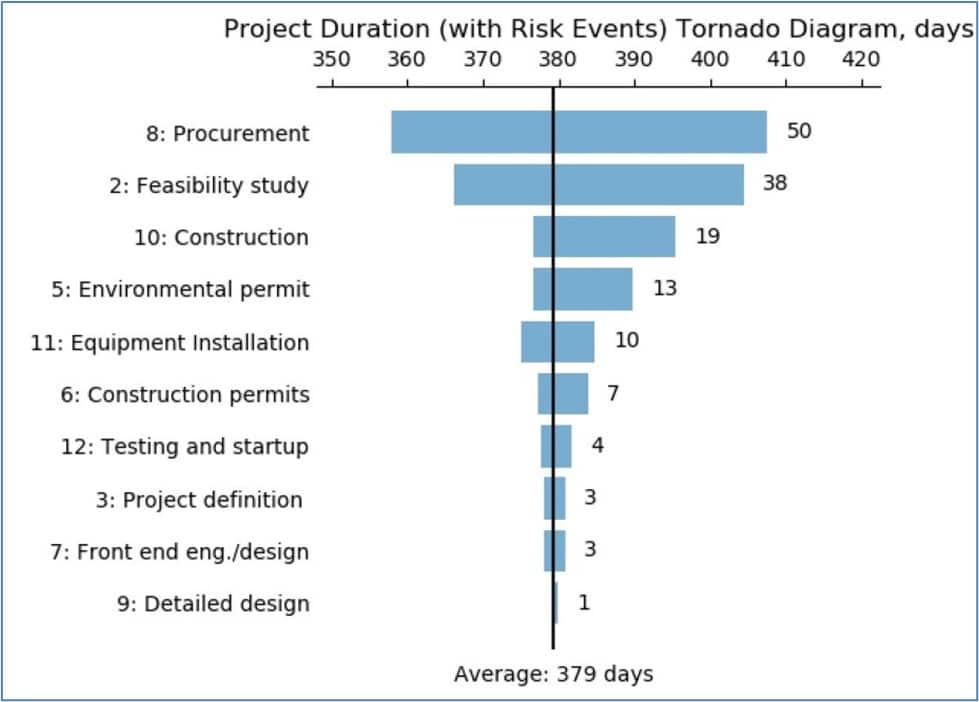
Figure 5: Tornado Diagram
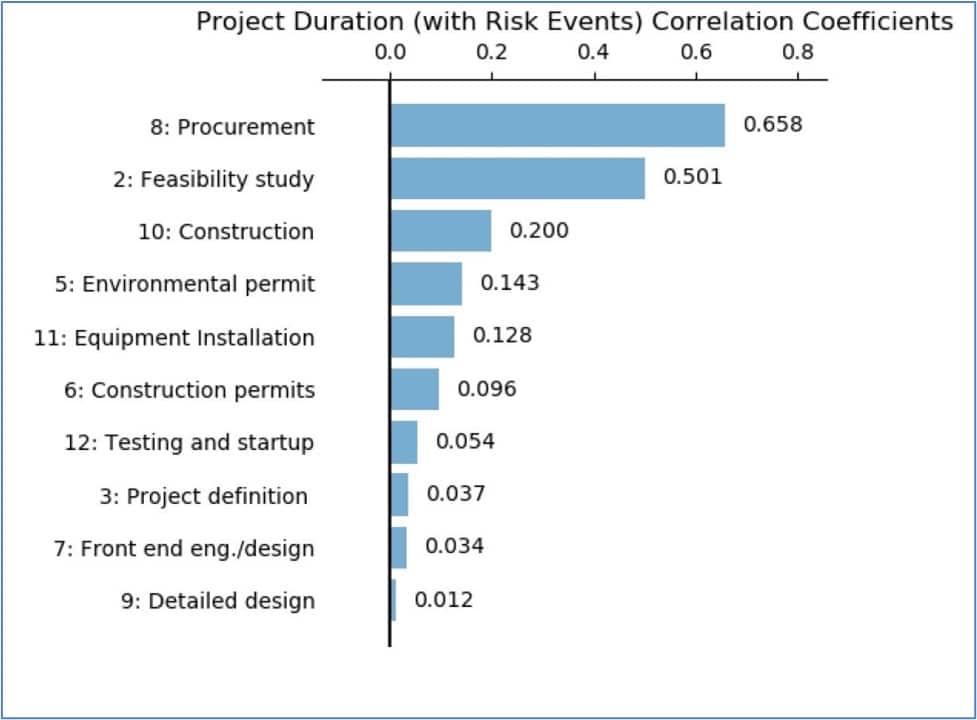
Figure 6: Correlation Coefficients
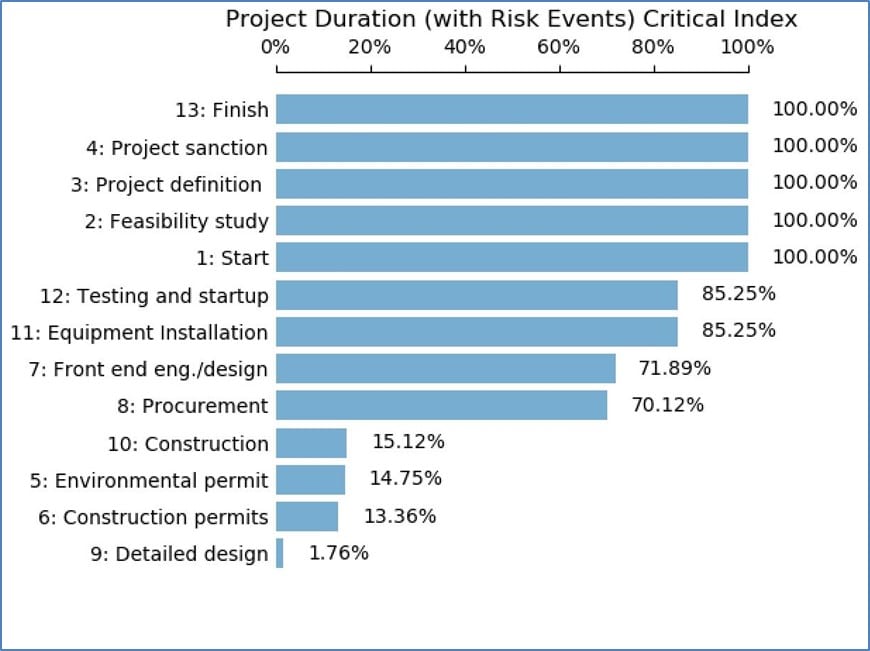
Figure 7: Critical Indexes
Table 7 below includes correlation coefficients, critical indexes as well as schedule impact indicators (SIIs). It also shows a ranked listing of risk events based on their SIIs. You may perform further sensitivity analysis by asking “what-if” questions. For example:
- What’d be the project schedule if none vs. all the identified risk events are accounted for (Fig. 4)?
- What if you start with an initial schedule accounting only for the variability risk but not the risk events and then add one risk event at a time (Fig. 8)?
- What if you start with a project schedule that considers variability risk and all the identified risk events together and then exclude one event at a time (Fig. 9)?
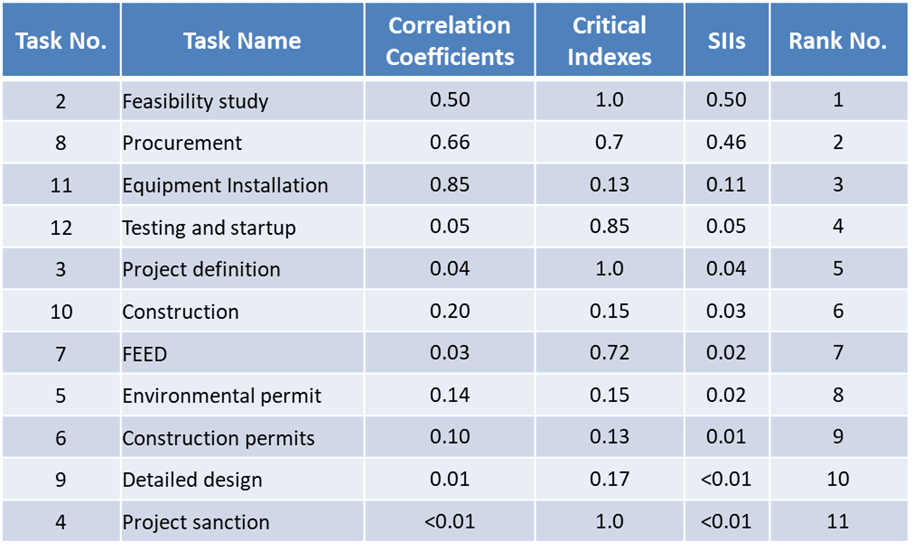
Table 7: Risk Impact Sensitivity Analysis (RISA) Factors
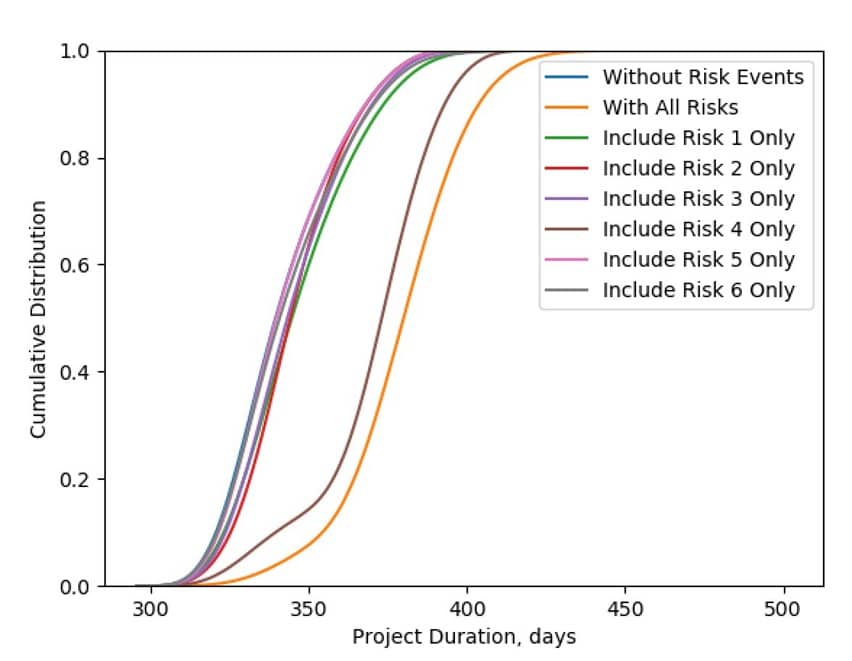
Figure 8: CDF Plots With Risk Events Added One at a Time
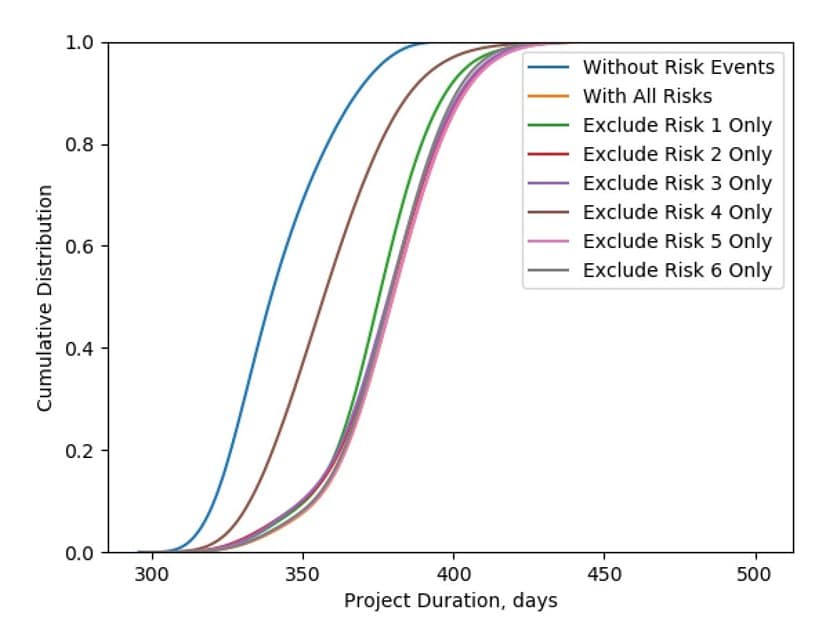
Figure 9: CDF Plots With Risk Events Excluded One at a Time
3.2.6 Risk Impact Sensitivity Analysis (RISA) Step 6: Develop Proper Response Actions For Each Risk
Based on the sensitivity analysis and the ranked listing of risks, develop proper response actions for each risk. Table 8 below lists proposed response actions for each identified risk and Fig. 10 below shows the same information by mapping response actions to individual tasks.
You can also evaluate the simulation results to find ways to reduce the project schedule. An evaluation of task correlation coefficients (relationship between project duration vs. task duration considering all the iterations) and critical indexes (percent times a task is on the critical path considering all the iterations) will give clues as to what task durations you want to reduce to gain significant reductions in project duration.
One key factor is “external” dependencies (e.g., supplies/services from vendors/contractors, permits from government agencies, etc.) over which project teams have less control.
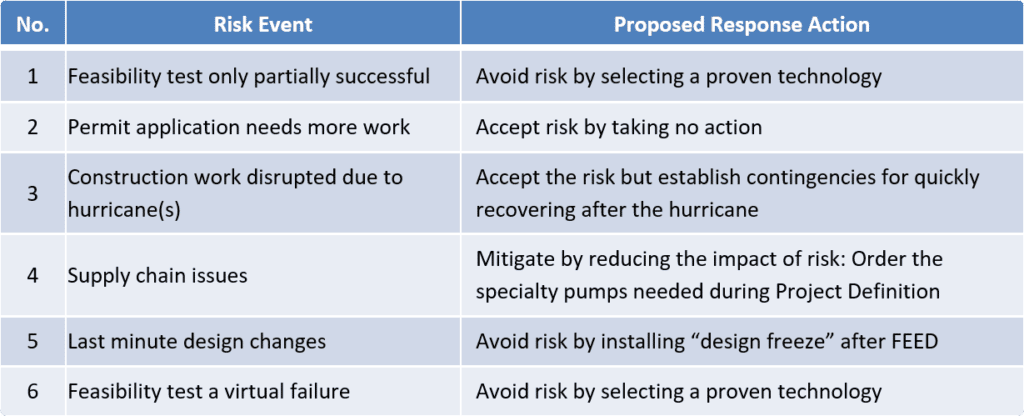
Table 8: Proposed Risk Response Actions
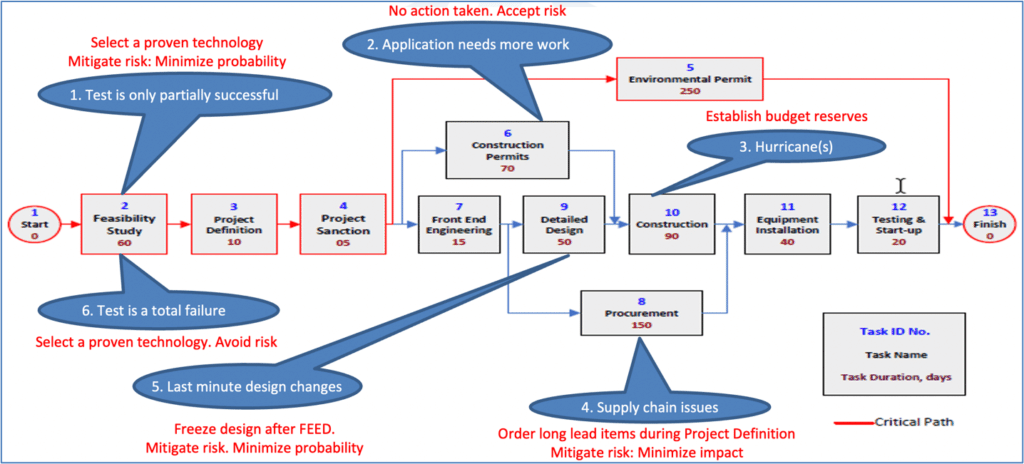
Figure 10: Proposed Risk Response Actions in Risk Impact Sensitivity Analysis Scenario
3.2.7 Risk Impact Sensitivity Analysis (RISA) Step 7: Repeat Monte Carlo Simulation With The Revised Risk Register
Revise the risk register (Table 9) by changing the risk probabilities and impacts and their distribution data to reflect the proposed response actions (Table 9) you’ve decided to implement.
Make sure to include in your scope of work any additional tasks created by your response actions. Furthermore, add any new risks (plus all the required data) that may be created by your response actions.
Then, repeat the Monte Carlo simulation using the revised risk register. The results will reflect the revised scope of work accounting for risk response actions.
Based on these results, you can negotiate with your project sponsor a mutually acceptable project schedule and contingency reserves you want to add to the schedule (Fig. 11 below). The reserves are designed to account for any residual or remaining risks.
3.3 Understanding the Results Provided by Risk Impact Sensitivity Analysis
An analysis of simulation results using various RISA tools can be revealing. It helps you understand the impact of individual task durations and risk events on the project schedule leading to more realistic project schedule estimates. You can learn what risks you should pay more attention to and how best you can compress the schedule, if need be.
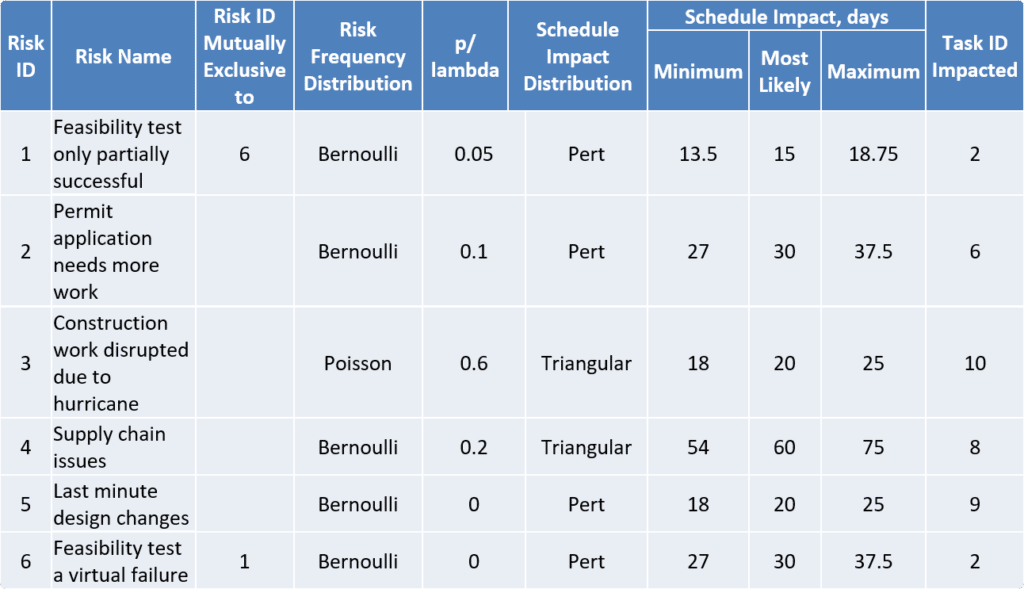
Table 9: Revised Risk Register After Using Risk Impact Sensitivity Analysis
The deterministic project duration estimate for Project Pinot is 325 workdays or 65 weeks (Fig. 1 and Fig. 2). When the variability risk is accounted for and a simulation is employed, the average project duration increased to 342 days—approximately by 5% (Fig. 3 and Fig. 4).
When both variability and events risks are considered, the average duration turns out to be 379 days—an approximately 17% increase compared to the deterministic estimate (Fig. 3 and Fig. 4).
If you received authorization for the deterministic project schedule of 325 days, the probability of completing Project Pinot under that duration is <5% (Fig. 4), because the variability and events risks are real and some of the risk events are bound to materialize extending the project finish date.
Schedule impact indicators (Table 7) are powerful, because they account for both critical indexes and correlation coefficients. They are a function of:
- Task duration
- Critical vs. non-critical tasks
- Float available on a non-critical task
- Impact of individual risks on a given task and overall project scope of work
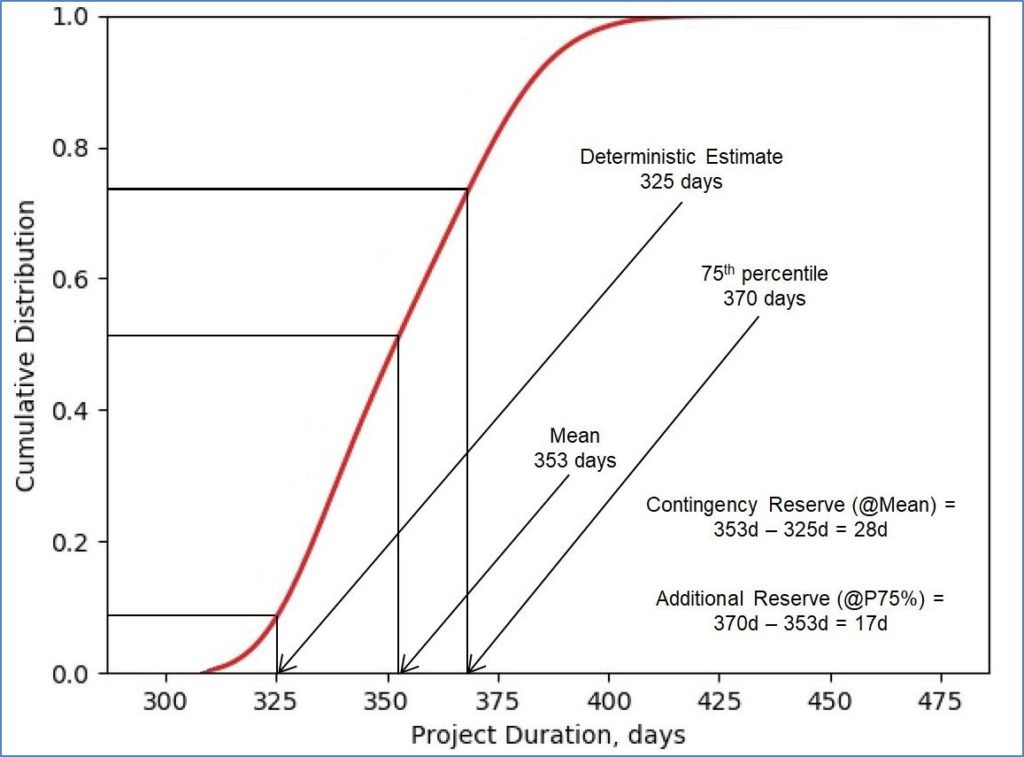
Figure 11: Estimation of Contingency Reserves in Risk Impact Sensitivity Analysis Scenario
For Project Pinot, Procurement appears on the top of the SII priority list, because:
1. It has a relatively high task duration.
2. It can be impacted by a risk event (hurricane).
3. It has a relatively low float (reflected in its critical index).
On the other hand, Detailed Design appears towards the bottom of the priority list, because: its duration is not high; the risk event associated with it (last minute design changes) has relatively low probability and impact; and it’s a non-critical task with a significant amount of slack.
Fig. 8 and Fig. 9 are effective visuals for communicating to the project sponsor and management the relative impact of individual risk events on the project schedule. Based on RISA you can seek answers to the following key questions:
- Which risk events should we take response actions for and what specific actions will we want to take? (Fig. 10, Table 8)
- Which tasks do we want to compress to accelerate the schedule and what measures will we take? (Fig. 10)
- How much contingency reserve we should add to the project’s deterministic base estimate? (Fig. 11)
A comparison of S curves from Fig. 4 (project schedule before risk response actions) and Fig. 11 (project schedule after risk response actions) reveals the following key findings:
- Deterministic base estimate: 325 days
- Stochastic estimate when only variability risk is considered: 342 days
- Stochastic estimate when all the identified risks are considered: 379 days
- Stochastic estimate after risk response actions are considered: 353 days
You may negotiate the required contingency reserves based on the S curve in Fig. 11. For example, the project manager/team may include a contingency reserve of 28 days on top of the deterministic estimate (325 days) and receive authorization for 353 days for the project duration. It will reflect a 50% probability level (called P50 schedule) for completing the project on time. This reserve translates to approximately 9% of the deterministic estimate. It will be under the control of and managed by the project manager.
The management may keep an extra 17 days of contingency reserve under their control to reflect a 75% probability level (called P75 schedule). This reserve is still called a contingency reserve—not to be mistaken for “management” reserve meant for the so-called “unknown unknowns.” Management may choose to add management reserve for unknown unknowns
4. Concluding The Steps For Risk Impact Sensitivity Analysis (RISA)
So, let’s recap our step-by-step approach to implementing Risk Impact Sensitivity Analysis in Project Pinot:
➡️ The probability of completing a project on time is probably <10%, if its duration estimate is deterministic and variability and events risks are not considered. A deterministic critical path method without consideration for risks will result in an overly optimistic/unrealistic schedule.
➡️ Incorporating variability and events risks into project schedules by means of stochastic methods will result in far more realistic project duration estimates thereby improving the chances of on-time project completion.
➡️ Risk Impact Sensitivity Analysis (RISA) is an effective approach to evaluate the sensitivity of the project schedule to risks. You can prioritize risks more objectively through a better understanding of the relative impact of risks on project schedules.
➡️ Simulations offer rational means for estimating schedule reserves.
➡️ Quantitative risk analysis helps you gain better insights into project risks, prioritize them based on their impact, answer “what-if” questions, estimate required reserves, and manage risks effectively leading to on-time project completion.
I hope you enjoyed learning from this blog post as much as I enjoyed writing it! More importantly, I’m glad to have shown you that quantitative risk analysis isn’t exactly rocket science.
Additional Resources
In fact, Quantitative Risk Analysis is identified as one of the fastest-growing project management fields with broad applications across different industries.
Would like to be a part of that growing group of project professionals implementing quantitative risk analysis in their projects? Are you ready to future-proof your career and increase your project success rates?
If the answer is a resounding yes, then you need to join Project Control Academy’s Quantitative Risk Analysis online training course. We have developed the most practical and step-by-step training program for you!
You do not need to be a statistician or a risk manager to be eligible to attend this course. As a project professional, you already have an understanding of project management, project scheduling, and cost estimating concepts. And that has effectively set the stage for you to get the full value out of this course. We can’t wait to see you there!
References:
[1] Hillson, D. and P. Simon. (2020). Practical Project Risk Management: The ATOM Methodology. 3rd edition, Berrett-Koehler Publishers, Inc., Oakland, California
[2] Hollmann, J.K. (2016). Project Risk Quantification. Probabilistic Publishing. Gainesville, Florida
[3] Hubbard, D.W. (2009). The Failure of Risk Management. John Wiley & Sons, Hoboken, New Jersey
[4] Hulett, D. (2016). Practical Schedule Risk Analysis. Routledge, New York, New York
[5] Kodukula, P.S. (2002). PM+ Blog. https://kodukula.com/kodukula-blog
[6] Schuyler, J. (2018). Risk and Decision Analysis in Projects. Edition 3.1, Planning Press, Aurora, Colorado
About the Author:
Dr. Prasad S. Kodukula, PMP, PgMP, DASM, DASSM, is a PMI Fellow, thought leader, coach, author, inventor, and entrepreneur with more than 35 years of professional experience.
As a global ambassador of project management, Prasad has spoken in nearly 50 countries and worked with 40 Fortune 100 companies.
He is co-founder and CEO of two companies: Kodukula & Associates, Inc., a project management training and coaching firm; and NeoChloris, Inc., a decarbonization company. He also teaches project management at the University of Chicago.
He was recognized three times by the Project Management Institute as “Best of the Best in Project Management” with 2020 PMI Fellow Award, 2016 Eric Jenett Project Management Excellence Award, and 2010 PMI Distinguished Contribution Award. He also received prestigious awards from the USEPA and the States of Kansas and Illinois for outstanding achievements in education, training, and technology innovation.
Prasad is a co-author or contributing author of ten books and more than 40 articles and holds four patents.
Connect with the author via LinkedIn.


